
Hey crypto mums (and dads)! It’s been way too long since my last post – between juggling the kids, work campaigns launching left and right, and trying to keep up with this wild crypto market, time just seems to vanish. But sometimes the universe gives you the perfect moment to sit down and share what’s been on my mind. With Bitcoin finally showing some recovery signs around $108K, it feels like the ideal time to talk about something we all struggle with: knowing when to take profits using Bitcoin dominance as our guide.
The Reality Check We All Need
Let’s be honest – we’ve all been there. Watching our portfolio climb, getting caught up in the euphoria, telling ourselves “just a little bit higher” until suddenly we’re watching those gains evaporate faster than our morning coffee gets cold. As busy mums managing households, careers, and crypto portfolios, we need practical strategies that don’t require us to stare at charts all day.
That’s where Bitcoin dominance theory comes in – it’s like having a market GPS that tells you exactly where you are in the crypto cycle.
Understanding Bitcoin Dominance: Your Secret Weapon
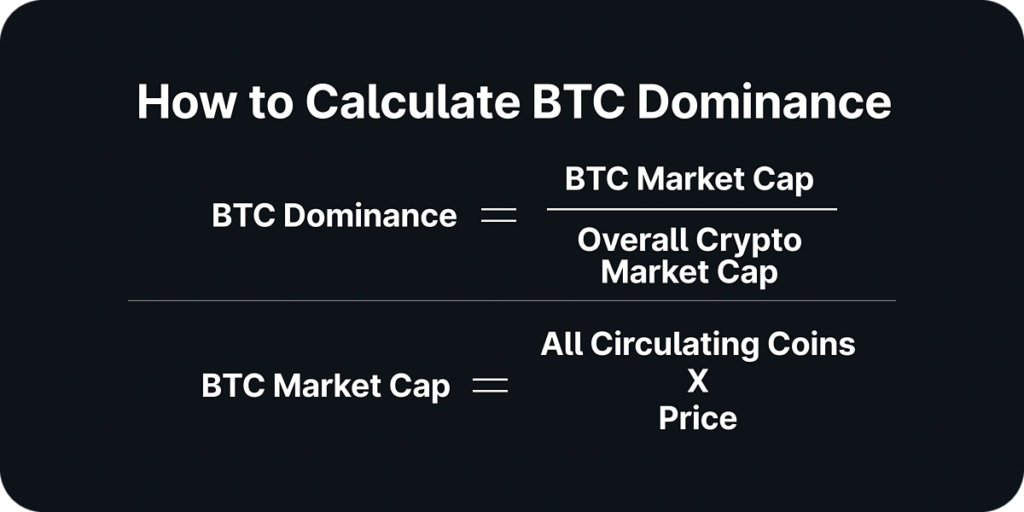
Bitcoin dominance measures Bitcoin’s market cap as a percentage of the total cryptocurrency market cap. Think of it as Bitcoin’s “market share” – and it tells an incredibly powerful story about where we are in any crypto cycle.
Looking at the historical dominance chart, you can see clear patterns that repeat over and over:
The Cycle Pattern Every Crypto Mum Should Memorize
Phase 1: Bitcoin Accumulation (High Dominance 60%+)
- Bitcoin leads and gains market share
- Altcoins struggle or move sideways
- Institutional money flows in
- This is the “safety first” phase
Phase 2: The Great Rotation (Dominance 45-60%)
- Money starts rotating from Bitcoin to major altcoins
- Ethereum and established altcoins wake up
- This is where balanced portfolios shine
- The sweet spot for diversified gains
Phase 3: Altseason Madness (Dominance <45%)
- Small caps and everything else goes wild
- Bitcoin dominance crashes as money floods altcoins
- This is usually the blow-off top phase
- Time for serious profit-taking
What History Teaches Us About Dominance
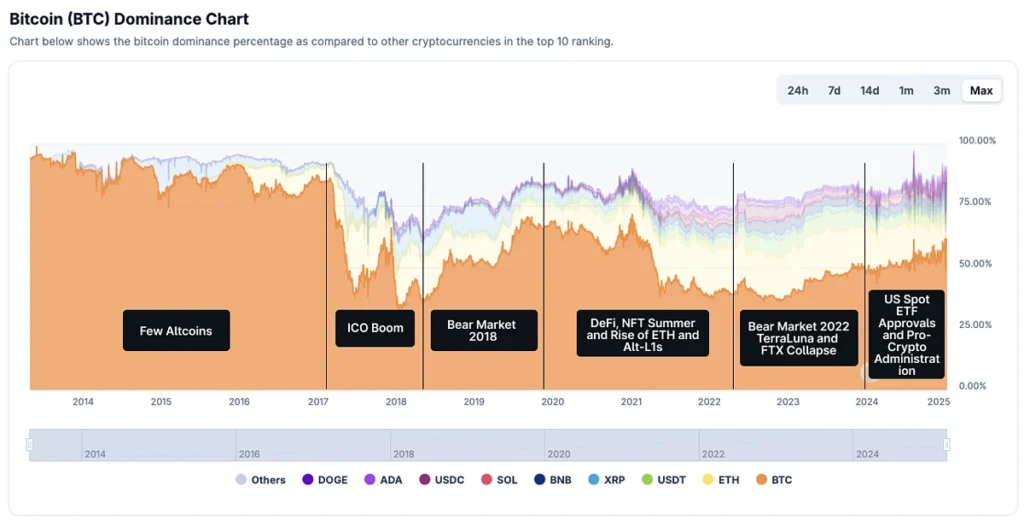
Looking at the dominance chart, you can see this pattern played out perfectly:
- 2017 ICO Boom: Bitcoin dominance crashed from 85% to 35% as everything went parabolic
- 2018 Bear Market: Dominance shot back up as altcoins got destroyed
- DeFi Summer 2020-2021: Another dominance decline as altcoins had their moment
- 2022 Bear Market: Back to Bitcoin safety as everything else collapsed
- 2024 Recovery: Bitcoin leading again with institutional adoption
Each time, the pattern is the same – Bitcoin leads, then money rotates to altcoins, then everything crashes and we start over.
Reading the Dominance Signals Like a Pro
Here’s where those handy charts come in. When Bitcoin dominance changes, it tells you exactly what the smart money is thinking:
When Dominance Goes UP:
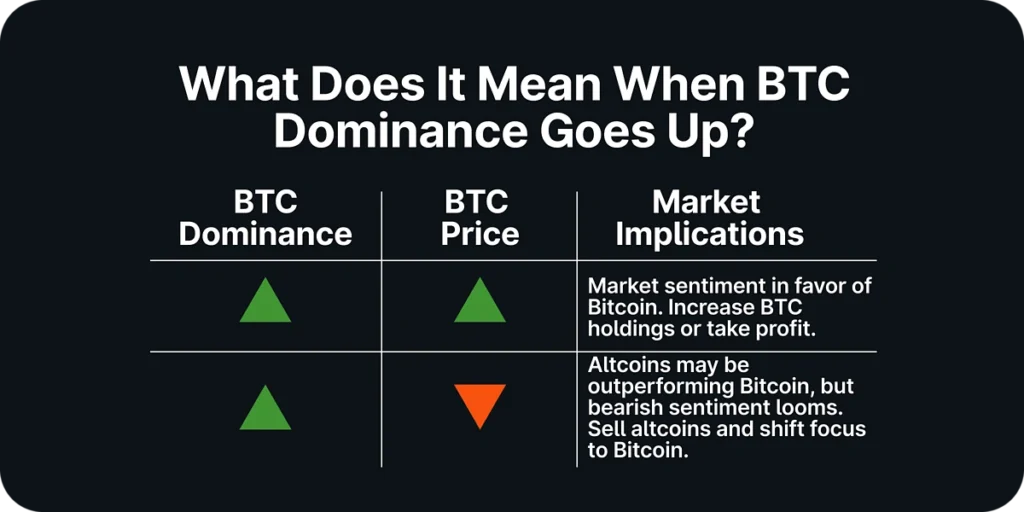
Scenario 1: Dominance ↑ + Bitcoin Price ↑
- What it means: Pure Bitcoin strength
- Action: Increase Bitcoin holdings or take profits
- Market mood: “Bitcoin is king, everything else is noise”
Scenario 2: Dominance ↑ + Bitcoin Price ↓
- What it means: Flight to safety (altcoins getting destroyed faster)
- Action: Sell altcoins, focus on Bitcoin or stablecoins
- Market mood: “Risk-off, bear market vibes”
When Dominance Goes DOWN:
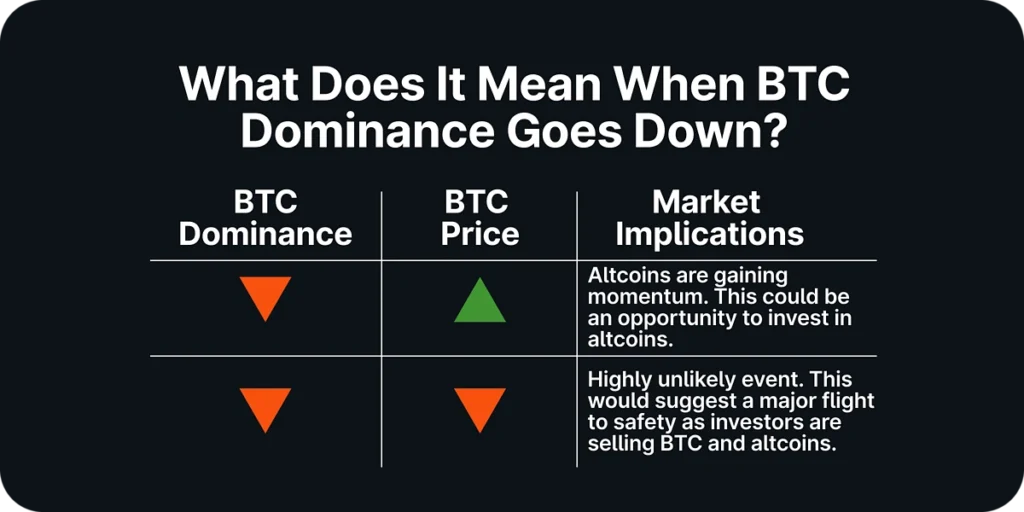
Scenario 1: Dominance ↓ + Bitcoin Price ↑
- What it means: Altseason is starting!
- Action: Perfect time to invest in quality altcoins
- Market mood: “Rising tide lifts all boats”
Scenario 2: Dominance ↓ + Bitcoin Price ↓
- What it means: Major market crash (rare but devastating)
- Action: Run for the hills, everything is selling off
- Market mood: “Panic mode activated”
Where Are We Right Now?
Based on current Bitcoin dominance levels and the $108K price point (as on May 23rd 2025), we appear to be in Phase 1 – Bitcoin accumulation mode. This means:
- Bitcoin is still the leader and gaining strength
- Altcoins are mostly underperforming (sound familiar?)
- We’re likely not in late-cycle territory yet
- But we should be watching for the rotation signals
The Busy Mum’s Dominance Strategy
Here’s how to use this practically without becoming a chart-watching zombie:
Portfolio Allocation Based on Dominance:
- Very High Dominance (65%+): 70% Bitcoin, 20% ETH, 10% altcoins
- High Dominance (55-65%): 50% Bitcoin, 30% ETH, 20% altcoins
- Medium Dominance (45-55%): 40% Bitcoin, 40% ETH, 20% altcoins
- Low Dominance (35-45%): Start taking profits across the board
- Very Low Dominance (<35%): Major profit-taking time
Monthly Dominance Check-Ins:
Set a monthly calendar reminder to check:
- Where is Bitcoin dominance trending?
- Has it broken any key levels?
- Do I need to rebalance based on the current phase?
The Rotation Alert System:
Watch for these signals that Phase 2 is starting:
- Bitcoin dominance starts declining consistently
- Ethereum begins outperforming Bitcoin weekly
- Volume shifts toward altcoin markets
- Your altcoin holdings start showing signs of life
Historical Exit Points That Worked
Looking back at successful exit strategies (I may not have followed it last time, but you can be smarter about it this time 🙂 )
2017 Peak: When dominance hit 35%, it was time to sell everything 2021 Peak: Dominance around 40% marked the local top for altcoins Current Cycle: We’re nowhere near those danger zones yet
The beauty of dominance theory is it removes the guesswork. You’re not trying to predict exact tops – you’re following the money flow.
The Mum Reality Check
Remember, we’re not day traders with unlimited time to analyze every market movement. We’re busy women (and men) with multiple responsibilities. The dominance strategy works because:
- You only need to check it monthly
- It gives clear signals about market phases
- It removes emotion from decision-making
- It’s based on proven historical patterns
What to Watch For Next
Given where we are in the cycle, here’s what I’m watching:
- Bitcoin dominance breaking below 55% – this would signal the start of rotation
- Ethereum consistently outperforming Bitcoin – the Phase 2 signal
- Quality altcoins showing sustained strength – confirmation that rotation is real
- Volume patterns shifting – money moving from Bitcoin to altcoin markets
Final Thoughts
The crypto market will always be volatile, but Bitcoin dominance gives us a roadmap through the chaos. Instead of wondering “when should I sell?”, you can follow the dominant cycle and make informed decisions.
Whether Bitcoin goes to $150K or pulls back to $80K, understanding dominance means you’ll be positioned correctly for whatever comes next. And honestly, as busy mums, we have enough things to worry about without trying to time perfect tops and bottoms.
The dominance cycle will repeat – it always does. Our job is to recognize where we are and position accordingly.
What’s your take on the current dominance levels? Are you seeing any rotation signals I might have missed? I’d love to hear how other crypto mums are using dominance theory in the comments below. Until next time, stay smart and stay dominant!
Remember: This is not financial advice. Always do your own research and never invest more than you can afford to lose. Crypto investments are highly risky and volatile.